Shipping Elasticsearch metrics to our tenants
As of April 2022, Elasticsearch has been migrated to Opensearch. This guide may still work but there’s no guarantee
As of July 2020 we provide Elasticsearch metrics to several tenant Prometheuses. This is an informal “alpha” and only on an in-hours, best-effort basis.
How it works
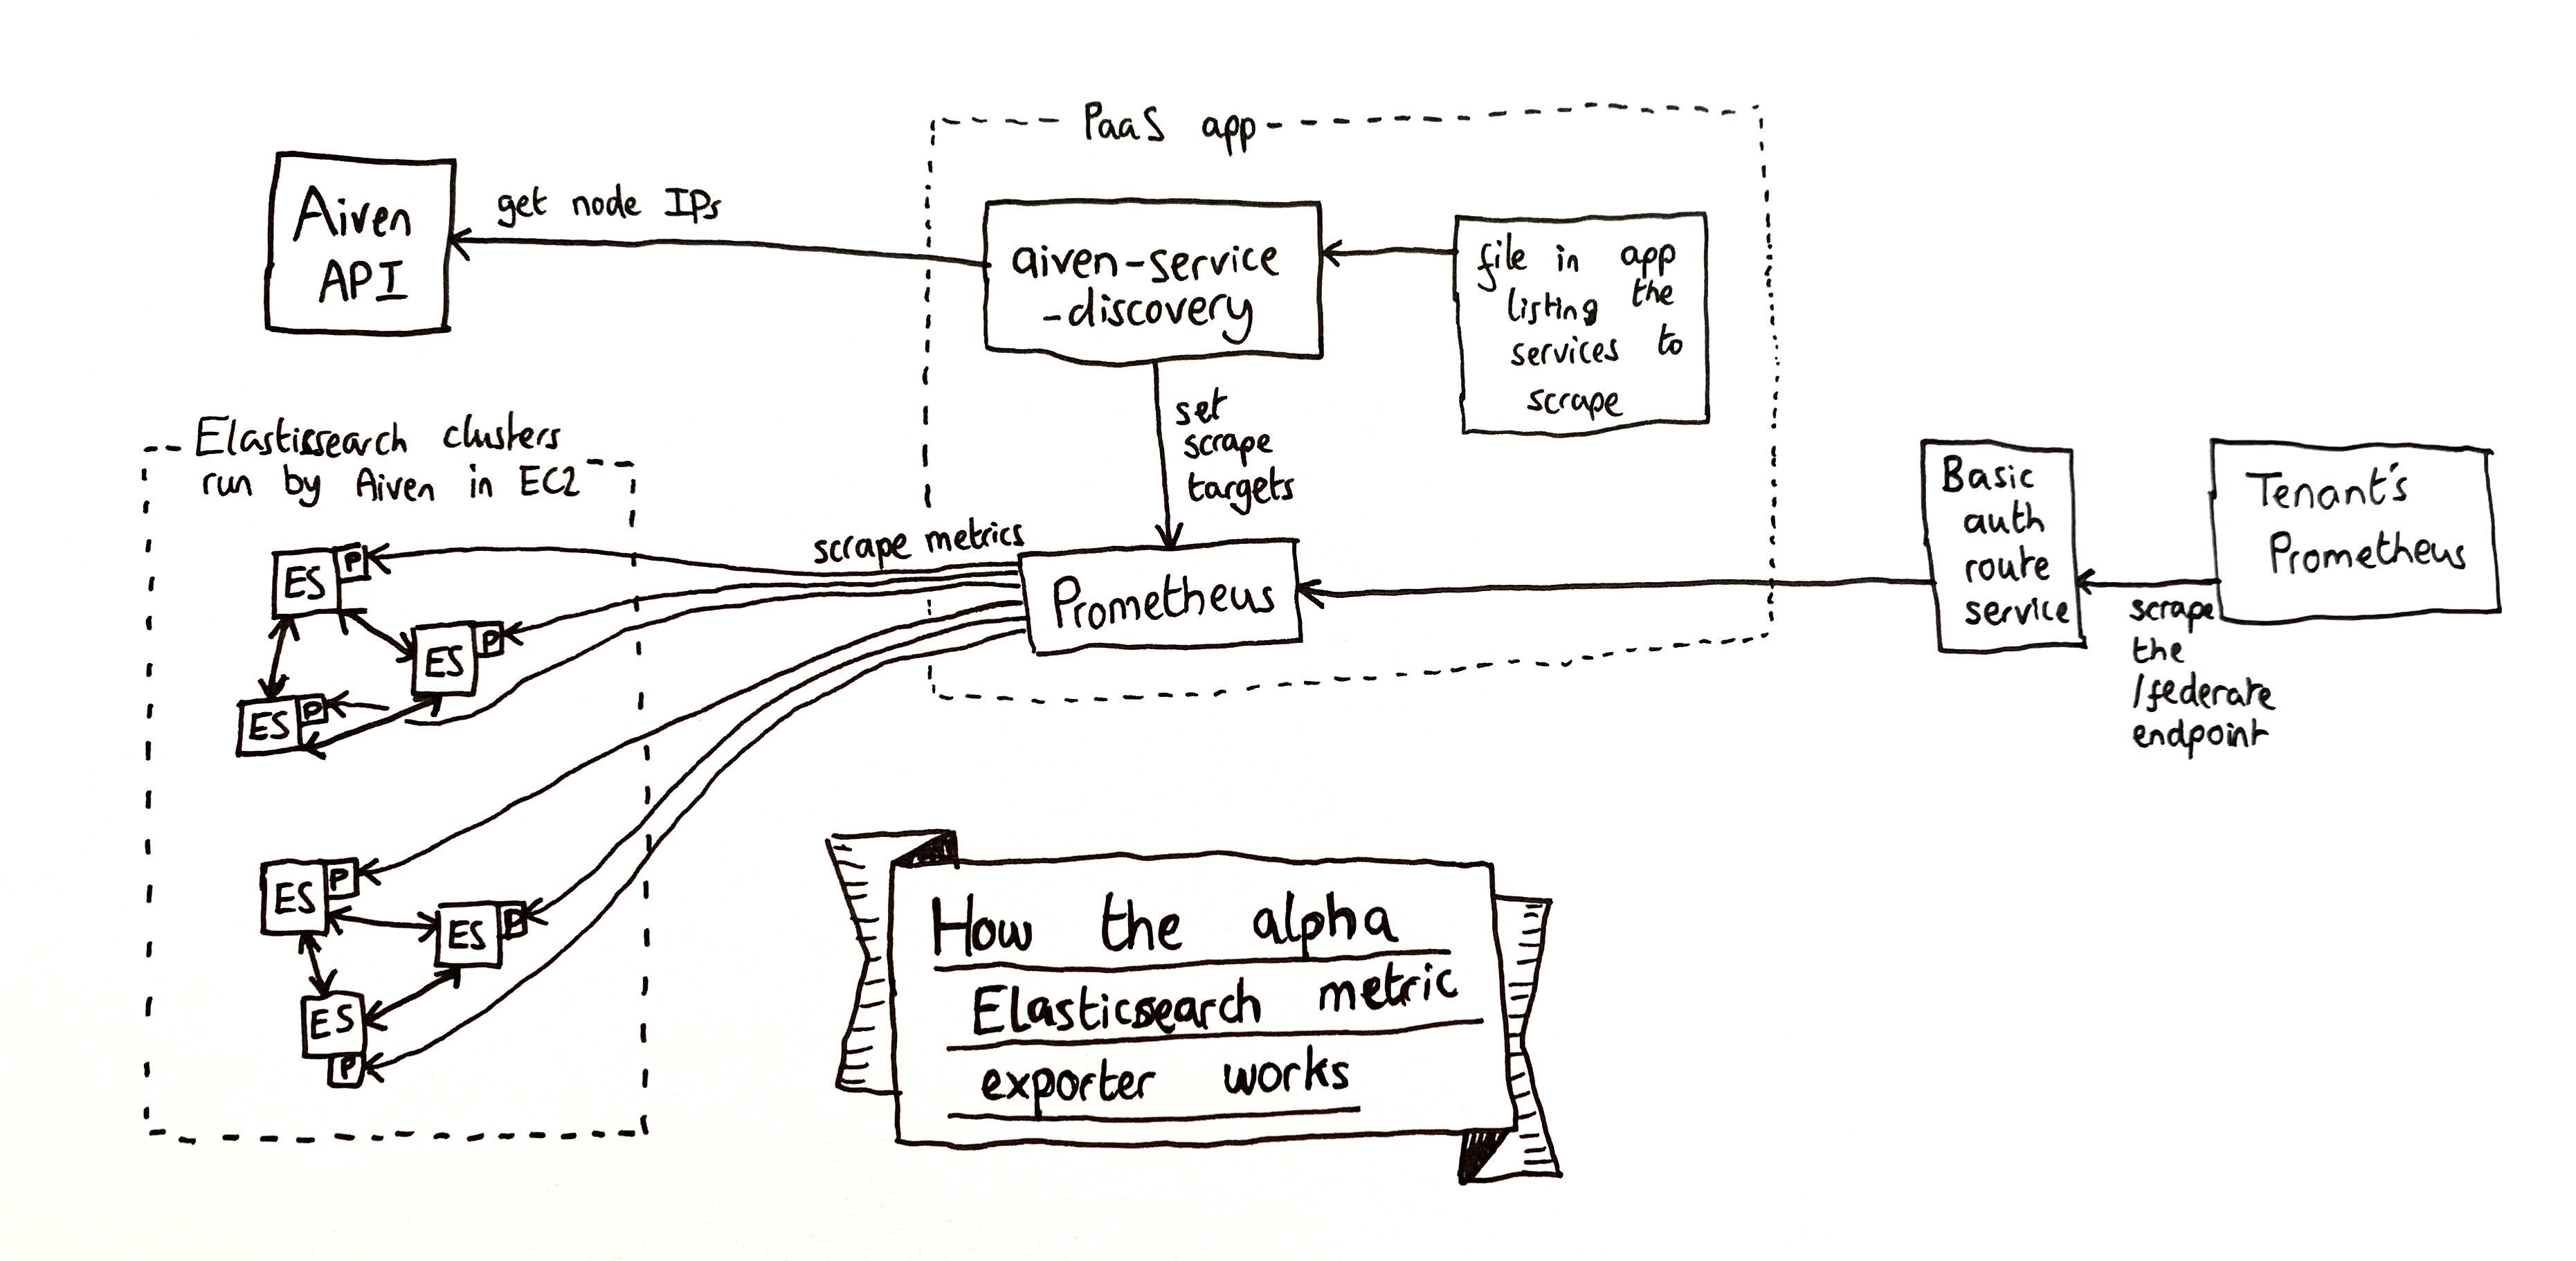 Link to SVG version of the diagram
Elasticsearch Metric Exporter alpha
Elasticsearch is an open source full-text RESTful search and analytics engine that allows you to store and search data.
GOV.UK Platform as a Service (PaaS) offer Elasticsearch as a service to our tenants. We procure Elasticsearch from Aiven, who offer fully managed open source data infrastructure running in public cloud environments. The GOV.UK PaaS Elasticsearch services are hosted on AWS EC2 instances in Ireland or London, depending on your choice of GOV.UK PaaS region.
In addition to the core data infrastructure services, Aiven offer a HTTP REST API (Aiven API) which allows automated access to and control of account and service configuration. Aiven also provide access to Elasticsearch metrics through Prometheus endpoints.
However, GOV.UK PaaS tenants are not able to access the Aiven API directly for security reasons. This is because:
- the Aiven API access credentials allow access to all services procured by GOV.UK PaaS
- access to Aiven services is restricted to GOV.UK PaaS IP ranges
To make Elasticsearch metrics provided by the Aiven Prometheus endpoints available to our tenants, GOV.UK PaaS are developing the Elasticsearch Metric Exporter app, which is currently in alpha.
The code and manifests are in a pull request on paas-observability-release.
How it works
The Elasticsearch Metric Exporter app runs two components, a Prometheus server and the aiven-service-discovery process as a sidecar.
The aiven-service-discovery process is configured by providing a JSON file that lists the services to collect metrics for. It then:
- connects to the Aiven API to identify the IP addresses of the services’ Elasticsearch nodes
- configures the scrape targets of the Elasticsearch Metric Exporter Prometheus server.
Once configured, the Elasticsearch Metric Exporter Prometheus server reads metrics from the Aiven Prometheus endpoints and stores them in an InfluxDB instance. Access to the server is provided by a basic auth route service.
We are operating one Elasticsearch Metric Exporter instance and one basic auth route service per tenant participating in the alpha. The apps and services are deployed in the monitoring space of the admin organisation in Ireland and London, respectively.
Tenants are able to access their Elasticsearch metrics by providing basic authentication credentials when accessing their Elasticsearch Metric Exporter instance. They can federate the metrics to a Prometheus server operated outside of GOV.UK PaaS by scraping the /federate endpoint of the Elasticsearch Metric Exporter instance.
Limitations of the alpha
The service list configuration of the aiven-service-discovery process is static. This means that if a tenant creates a new Elasticsearch service, they will not receive its metrics until the configuration is manually updated and the Elasticsearch Metric Exporter redeployed.
If something goes wrong
Don’t worry. This is an informal “alpha” and only on an in-hours, best-effort basis.
Ideas for debugging:
- Access the Prometheus using the credentials from
cf envon the route service app- See if it is still receiving metrics
- Look at the Targets page and see whether it is still scraping data from all the tenant’s Elasticsearch nodes
- Look at the Elasticsearch services in Aiven and see if you can
make metrics requests manually (use
cf sshso your requests come from the PaaS IP ranges) - Talk to Aiven support
- Ask Miki or Andy for help (we worked on it originally)
How to set it up for a new tenant
Checkout the code from github.com/alphagov/paas-observability-release/pull/5 and make a copy of one of the existing manifests.
Next you need to make a JSON file listing all their service instances and some metadata that will be turned into Prometheus metric labels. Unfortunately we don’t have a script for this yet. Here’s an example:
[
  {
    "aiven_service": "${DEPLOY_ENV}-${SERVICE_INSTANCE_GUID}",
    "extra_labels": {
      "service_guid": "${SERVICE_INSTANCE_GUID}",
      "service_name": "${SERVICE_INSTANCE_NAME}",
      "space_guid": "${SPACE_GUID}",
      "space_name": "${SPACE_NAME}",
      "org_guid": "${ORG_GUID}",
      "org_name": "${ORG_NAME}"
    }
  },
  …
]
Save that list in the same directory as the manifest and alter
SERVICES_FILE in the manifest to be named appropriately.
Also alter the rest of the manifest so that its names match your
tenant.
Now it’s time to deploy. cf push the manifest using --var to
provide values for the Aiven secrets it requires. You can get those
values from an existing app or our credential stores.
Visit the app URL and you should see a Prometheus interface. Check its Targets page and you should see it scraping data from all the nodes of the Elasticsearch services you configured in the JSON file. Check the metric graphs look sensible (you can compare them to ones in Aiven’s interface.)
Once that’s working OK it’s time to deploy a basic auth service in front of the app. Our public documentation says how to do that.
Finally you need to help the tenant configure their Prometheus. By default there are 700-ish different metrics reported, and tenants probably don’t want to saturate their Prometheus with that much data. We have an example Prometheus config and a spreadsheet showing what metrics are available.